SVC 01
Crop Health Mapping (NDVI & NDRE)
See stress, disease, and nutrient problems weeks before your eyes can
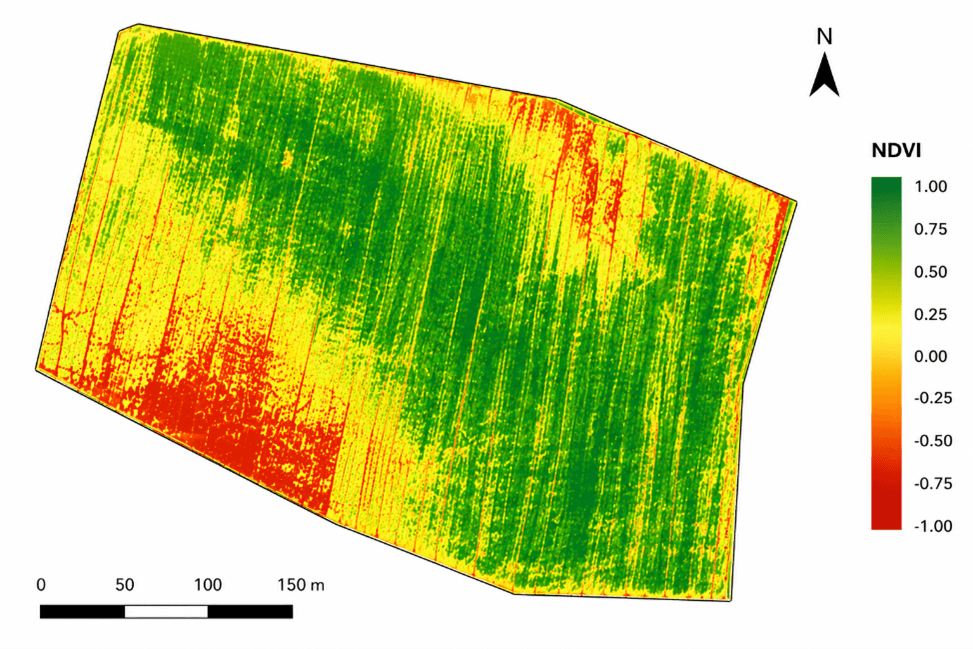
Multispectral sensors read light your eye can't see. Healthy plants reflect near-infrared strongly; stressed plants don't — and that difference shows up in imagery before visible symptoms appear. NDVI maps reveal poor emergence, disease pressure, water stress, and nutrient deficiency across the whole field at once.
NDRE goes further in thick canopy — it keeps differentiating plant health in dense corn and soybeans where standard NDVI maxes out, which makes it the right tool for mid-season nitrogen decisions.
We fly the DJI Mavic 3 Multispectral: four 5 MP multispectral bands (green, red, red-edge, near-infrared) plus a 20 MP RGB camera, with a sunlight sensor that normalizes readings so maps flown on different days are actually comparable. RTK positioning holds the aircraft within ±10 cm, so a spot you flag in June is the same spot in August.
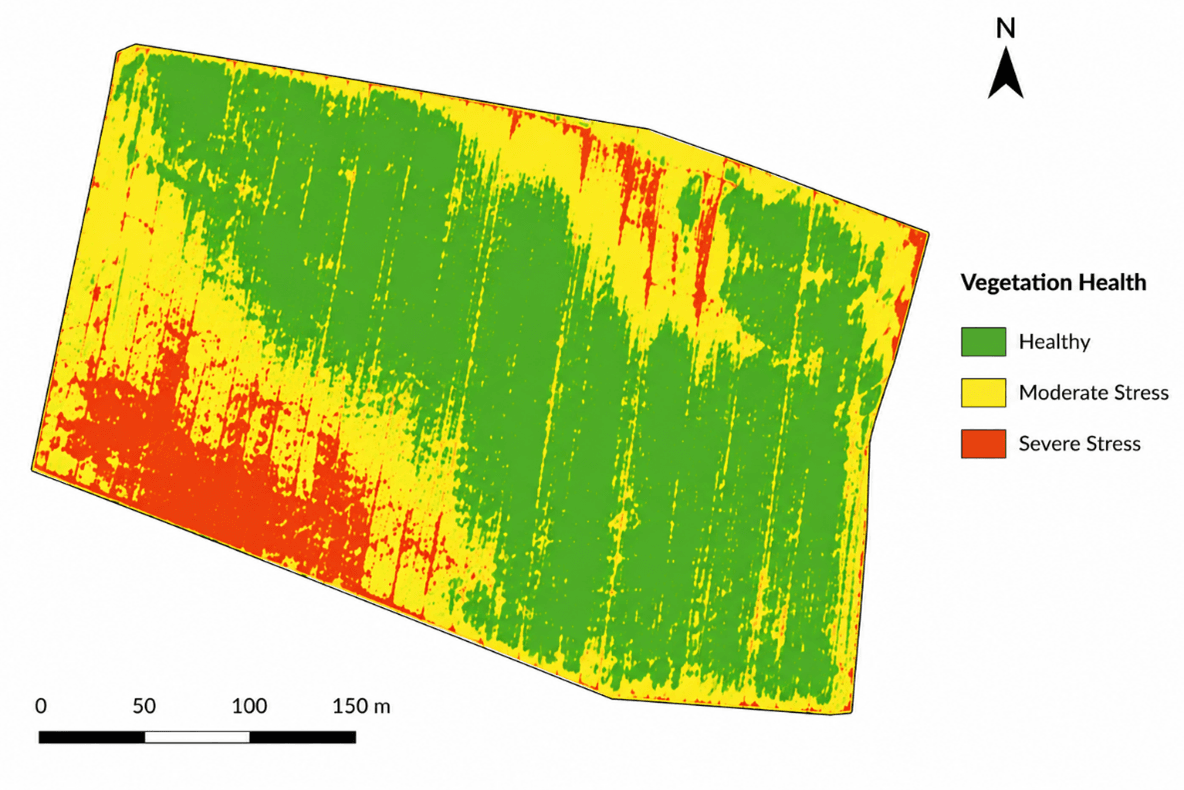
You get georeferenced heat maps, management-zone classification, and plain-English interpretation — delivered as PDF plus GIS files (.shp, .kml, GeoTIFF) that load straight into John Deere Operations Center, Climate FieldView, or any major farm platform.
Who this is for
Row-crop operators making fungicide and fertilizer timing calls, farm managers overseeing multiple tracts, and agronomists who want objective data behind recommendations.
Most valuable April–September, flown on a schedule or on demand.
Ready to put a pilot on your fields?
Quotes are free, straight, and same-day. Tell us what you're up against.